
Crude oil is a naturally occurring liquid hydrocarbon found in underground geological formations. It is the raw, unrefined state of petroleum, a complex mixture of thousands of different organic compounds, predominantly alkanes, cycloalkanes, and aromatic hydrocarbons.
Formed over millions of years from the compressed remains of ancient marine organisms, it is, in the most literal sense, stored solar energy.
Before crude reaches a consumer, it must pass through refining, where heat and chemical processes separate it into distinct product streams. Gasoline, diesel, jet fuel, heating oil, lubricants, asphalt, petrochemicals, and plastics all originate from a barrel of crude. This makes oil not merely an energy source but the molecular backbone of modern industrial society.
A standard barrel of crude oil contains 42 US gallons. From that single barrel, a typical refinery produces roughly 19 to 20 gallons of gasoline, 11 to 12 gallons of diesel and heating oil, 4 gallons of jet fuel, and smaller volumes of propane, asphalt, and specialty chemicals. Nothing is wasted.
Table of contents
- How Crude Is Classified
- The Three Benchmark Prices
- Global Oil Industry Segments
- How Oil Prices Affect the Economy
- Investor’s Takeaway
How Crude Is Classified
Not all crude oil is alike. The market classifies crude along two primary axes: density (light versus heavy) and sulfur content (sweet versus sour). These two dimensions determine how much the crude is worth, which refineries can process it, and what products it yields.
Density: Light vs. Heavy
Density is measured using API gravity, a scale developed by the American Petroleum Institute where higher numbers indicate lighter oil. Light crude (API gravity above 31.1°) is easier and cheaper to refine, yielding more high-value products like gasoline. Heavy crude (API gravity below 22.3°) requires more intensive processing and commands a discount. Medium crude sits in between.
Sulfur: Sweet vs. Sour
Crude with sulfur content below 0.5% is called sweet; above 0.5% is sour. Sweet crude is preferred because sulfur is corrosive to refinery equipment and must be removed before products can meet fuel quality standards. Refineries that can handle sour crude — known as complex or coking refineries — earn a spread advantage by processing cheaper feedstock into the same high-value products.
The Three Benchmark Prices
WTI — West Texas Intermediate
The US benchmark, delivered at Cushing, Oklahoma. Light and sweet, it trades on the NYMEX. Each futures contract covers 1,000 barrels. Historically trades at a slight discount to Brent due to landlocked logistics, though geopolitical disruptions can invert this spread. Currently around $99 per barrel.
Brent Crude
Sourced from the North Sea, Brent is the international reference price for roughly 70% of globally traded crude. Trades on the ICE Futures Europe exchange. Because it is seaborne, Brent better reflects true global supply and demand. Currently elevated above $100 per barrel due to Hormuz disruptions.
Dubai / Oman
The primary benchmark for Middle Eastern crude sold eastward to Asian refiners. It is a medium sour grade that reflects the quality of the bulk of Gulf production. Asian buyers negotiate their long-term supply contracts using the Dubai average as a base, adjusted by a monthly differential.
The Global Oil Industry
The oil industry is divided into three segments: upstream (exploration and production), midstream (transportation and storage), and downstream (refining and marketing). Each segment has different economics, risk profiles, and investment characteristics.
Upstream: Finding and Producing
Upstream is where oil is found and lifted from the ground. It encompasses seismic surveys, exploratory drilling, field development, and production. The industry uses a key metric called the breakeven price, the oil price at which a producer covers all costs and earns a normal return.
Saudi Aramco's onshore fields break even below $10 per barrel. US shale producers require roughly $40 to $60 per barrel depending on the basin. This cost heterogeneity is why OPEC policy choices have such different effects across geographies.
Midstream: Moving the Molecules
Pipelines, tankers, rail cars, and storage terminals form the circulatory system of the oil market. The US has over 190,000 miles of petroleum pipelines.
Globally, very large crude carriers (VLCCs) transport the majority of seaborne oil, each capable of carrying 2 million barrels. Midstream assets tend to have relatively stable cash flows because they are paid on a fee per unit moved basis regardless of commodity prices.
Downstream: Refining and Products
Refineries convert crude into saleable products. Refinery economics are measured by the crack spread, the difference between the price of refined products and the crude feedstock.
A wide crack spread signals strong refinery margins.
Global refinery throughput reached approximately 86 million barrels per day in 2024. China and India have been adding refining capacity aggressively, shifting the downstream center of gravity toward Asia.
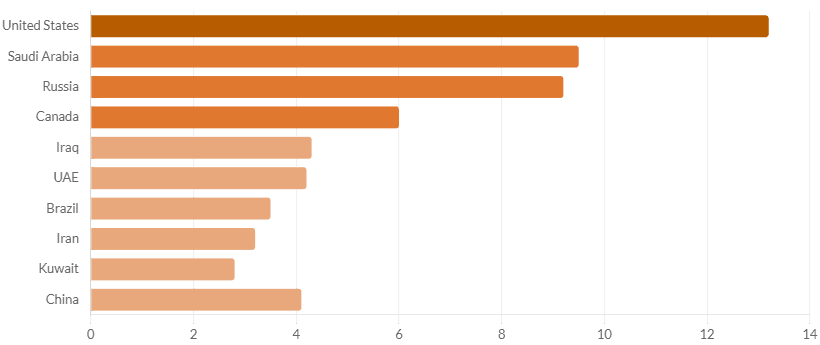
Major Producers
The United States produces more crude than any other nation at 13.2 million barrels per day in 2024, a level that would have seemed impossible a decade ago before the shale revolution.
Saudi Arabia and Russia follow, each producing roughly 9 to 10 million barrels per day.
The Permian Basin alone accounts for nearly half of all US production. OPEC+ member countries collectively account for 47% of global crude output, giving the bloc significant but not absolute pricing influence.
How Oil Prices Ripple Through the Economy
Oil price moves transmit into the broader economy through several distinct channels. Understanding these transmission mechanisms is essential for any macro-aware investor.
Inflation
Energy is both a direct consumer expense (gasoline, heating fuel) and an input cost embedded in the price of virtually everything else. A sustained $10 per barrel increase in crude adds roughly 25 to 30 basis points to headline CPI in the US.
In energy import dependent economies like India and Japan, the inflationary pass-through is considerably larger. This is why central banks closely track energy prices when calibrating monetary policy, and why sustained oil shocks complicate the inflation-growth tradeoff.
Corporate Margins
Airlines, shipping companies, chemical producers, plastics manufacturers, and logistics firms are directly exposed to crude prices through their fuel and feedstock costs.
Airlines typically hedge 30 to 50% of their annual jet fuel needs using crude or crack spread derivatives. Petrochemical producers benefit from cheap naphtha and LPG when crude falls, but face margin compression when crude rises faster than product prices can pass through to end consumers.
Trade Balances and Current Accounts
Oil importers like India, Japan, South Korea, and the eurozone see their trade balances deteriorate when crude rises.
India imports approximately 85% of its oil needs. Each $10 per barrel increase in crude adds roughly $15 billion annually to India's import bill, widening the current account deficit and pressuring the rupee.
For Gulf exporters, the same price move generates a windfall that flows into sovereign wealth funds and public spending, with second-order effects on Gulf construction, consumer, and real estate sectors.
Equity Markets
The relationship between oil and equities is not linear or consistent. In environments where oil rises due to strong demand, equities generally rally alongside it.
In supply-shock scenarios where oil rises because of a sudden supply disruption, the inflationary and recessionary risks it creates tend to weigh on broad equity markets.
Energy sector stocks benefit directly from higher prices, but consumer discretionary, transportation, and industrial sectors face headwinds. Historically, very high oil prices (above $100 per barrel sustained) tend to act as a growth tax on the global economy.
Investor’s Takeaway
Crude oil is not merely a commodity, it is the price of economic activity itself. Here is what every investor should hold in mind.
- The oil price is a composite signal: it reflects global growth, geopolitical risk, the strength of the US dollar, and OPEC's political cohesion all at once. No single variable explains it.
- The Brent-WTI spread matters. A wide spread (as seen in early 2026) signals geographic disruption, not just aggregate supply changes. It has direct implications for logistics costs and non-US energy equities.
- Oil importers and exporters experience the same price move as mirror images of each other. A rising oil price is simultaneously a growth shock for India and a fiscal windfall for Saudi Arabia. Portfolio construction must account for this asymmetry.
- The energy transition has reduced oil demand growth rates in OECD economies, but the structural underpinnings of demand in petrochemicals and non-OECD transport remain robust through at least 2035.
- Short cycle US shale production caps the sustainable upside, but geopolitical supply shocks can temporarily overwhelm any structural ceiling. The April 2026 Hormuz crisis is the clearest demonstration of this in a generation.

